This is strange. I now got some working rt kernel compiled (what a big difference in stability for low latencies!), and did some superficial testing of renoise.
Now I do get the spontaneous x-runs in jack, reported as renoise not finishing, but they don’t seem to produce any clicks or so anymore. What often does click, is loading a new song. Strangely when I have 2 instances of renoise open, both playing, the chances of clicks and/or registered x-runs seem drastically reduced. The spontaneuous x-runs seem happen “out of no reason” btw. - sometimes even in passages where the dsp load is a lot less that in others, or even while relative silence and little processing is on (song stopped). This tested with renoise-native only songs (also dblues new demo song), as some plugins seem to me to raise chances of x-runs at low latencies. At down to 64/2@48khz, 2ms latency - it is quasi the same effect with less heavy action when loading a new song when raising up to 8ms (192/2), above 8-10 ms with realtime kernel I won’t get those strange x-runs anymore.
Will test guitar/mic recording with and within renoise soon, let’s see if there are audible glitches under the very low latencies, or whether the x-runs are only “soft” in character and could be ignored for the time being.
Maybe linux/jack people are just much more allergic to it and keep watching of the x-run counter in paranoia - compared to other folks who would only start to be concerned when there were audible clicks and dropouts in the audio. On the other hand renoise seems to do something not-so-clean in this regard, normally one would expect to stable operation = zero x-runs on the counter. Also the counter does have its reason in showing when glitch-free operation is going on, and when not to trust the results.
Hey, thanks for pushing the tests further - at least it shows that I’m not schizophrenic ;-).
I still didn’t do my homework with cyclic measurements due to holidays away from the audio computer, but it’s still on my todo list.
Even if a specific issue with Renoise is highlighted, I don’t think that’s anything that could be fixed at this stage of 3.1 development.
I’ll continue nevertheless testing performance as Renoise is now the center of my workflow. Maybe this thread could be moved to the regular Support & Bugs section?
Regarding the xruns: as you pointed out, they are not necessarily audible, and I have an idea why. This is probably because Jack2 is doing a great job at masking them (at least if you compare to jack1). It does so by using an additional buffer (called async mode).
A better explanation is the answer from falkTX in the thread below:
https://linuxmusicians.com/viewtopic.php?f=27&t=14000
If you want to hear all the horror, it is possible to revert to jack1 behavior by starting jackd with the -S switch.
(Just as a precision: all my testing is done with jack2 in async mode).
Of course, you can also completely disable xrun reporting in qjackctl - that’s what I do when they become too annoying. But that’s not what I would call fixing the issue…
It’s better. Not sure what changed, but 3.1 gold performs smoother than the betas/RCs.
I just ran a 1h30 session at 2 msec without a single xrun - sweet!
Update: 1 month later, still trying to figure out what is going on with latency. Config workable, but those xruns remain an annoyance.
Running cyclictest on all available cores at the same priority as Renoise with a pattern looping shows at least something going on:
^C[root@pill-mobile4 gimmeapill]# cyclictest -p95 -t
# /dev/cpu_dma_latency set to 0us
policy: fifo: loadavg: 1.43 1.31 1.05 1/254 874

T: 0 ( 868) P:95 I:1000 C: 91778 Min: 6 Act: 7 Avg: 17 Max: 182
T: 1 ( 869) P:95 I:1500 C: 61185 Min: 6 Act: 10 Avg: 17 Max: 280
T: 2 ( 870) P:95 I:2000 C: 45889 Min: 6 Act: 8 Avg: 16 Max: 189
T: 3 ( 871) P:95 I:2500 C: 36711 Min: 6 Act: 12 Avg: 18 Max: 195
same priority is no good idea - cyclictest and the renoise worker threads will “fight” each other, draining each other’s processing power. So those results are no use at all. My idea of running both at the same time was just for…putting cyclictest (I run with “./cyclictest -S -m -p 96” then, so it will measure all cores!) as a “test guard” above renoise at same conditions as renoise would run normally…and ignore the x-runs while doing so! So if you got a sudden peak in cyclic and a glitch in renoise at the same time, then it wasn’t renoise fault but something else robbing cpu time. This was just for looking whether other stuff “breaks” latency for renoise if renoise is running with a normal session at the same time. For testing general realtime capability at a prio/setup - run cyclictest alone at same prio as renoise ("-S -m -p 95"), but not renoise at the same time. Point is to see whether under normal circumstances (also graphics action, networking if required, stuff like this) renoise can get as much realtime computing power as it’d need.
Just run cyclic with all your tweaks enabled and jack running at prio 95. Unless you got way up max numbers much above 200-300 after some longer time, your system should be of. Those are microsecond - 200 µs means 200 microseconds, not ms/milliseconds, so the cyclictest task had to wait a maximum of 0.2 milliseconds (ms) to be scheduled.
The systematic renoise x-runs seem to me as not to come from system, but rather from renoise being not designed for ultra-low-latency under linux by itself. I got my cyclictest in one configuration to worst care around 110-125 µs with min and avg at 1 and 2-3 (the 120µs peaks seem to be smi action going on every xx seconds on my system on a random core, yuck…) on all cores after real long real condition tests. But I have xruns also sometimes “out of nothing”, and often at some occurances with raising chance the lower the latency is.
Things to trigger x-runs I have found for me:
-
no appearent reason to see (even under low load), but seldom, and I haven’t have them audible yet
-
messing with the convolver, audible
-
switching amp model on cab sim, badly audible like hell
-
loading a tune, audible - heh, it resets the engine, but a second renoise doesn’t seem to glitch at the same time
-
heavy load tunes (i.e. first “helmet” version from “TheBellows” in the Downloads here) sometimes display low load (like in the 40s or 50s on my 6 core machine), but can sometimes trigger random x-runs (with audible glitches), also for no appearent reason to see compared to other, more stressful parts of the songs…maybe it is just that one core is maxed and so there the xruns do come from…
I did it on purpose to show the worst possible figures with cyclic test fighting with Renoise and some system load.
I tried already running at various priorities (80-99) with and without Renoise. When nothing else is running, everything clicks at less than 100-120 µs. Xruns start around 200 µs with my jack settings (jackd -P89 -r96000 -p64 -n3).
But now I see your point: running cyclictest above the rest as a kind of watchdog - good idea!
There a grapher for cyclictest that could make a nice complement (part of the “Tuna” suite by Red Hat):
https://access.redhat.com/documentation/en-US/Red_Hat_Enterprise_MRG/1.3/html-single/Tuna_User_Guide/index.html#sect-Tuna_User_Guide-Using_Testing_Tools_with_TUNA-Oscilloscope
I’ll try that, but would rather run it below Renoise, jack & co. so that I doesn’t create unnecessary xruns. If there’s a peak, audio stuff will still get served first and it should be visible anyway in the graph. Some other tools of the Tuna suite might be useful also (there’s an easy tool to fiddle with cpu affinity).
Going back to Renoise, I have one thing to add to the list of particular actions that cause xruns 99% of the time: reordering instruments (even when not playing).
Played a bit with tuna & oscilloscope yesterday, and apart from bringing back a few gnome 2 era dependencies, no particular breakthrough.
Oscillope cannot really swallow the output of cyclictest in multi threaded mode so the figures have to be taken with a grain of salt (it shows peaks below 50 micro secs while xruns are occuring - not very helpful).
Tuna has a very user friendly interface for tweaking the kernel in real time (scheduler, cpu affinity, various allocation thresholds), but I still didn’t manage to translate this into anything that would directly benefit my Renoise session or help trace the process(es) stealing cpu priority…
Progress: one latency source identified with LatencyTOP http://lwn.net/Articles/266153/
The ext4 driver (jbd2) is apparently waiting for sda1 (my mechanical HDD mounted as /home) - the root filesystem being on a smaller M2 drive sdbx.
6570 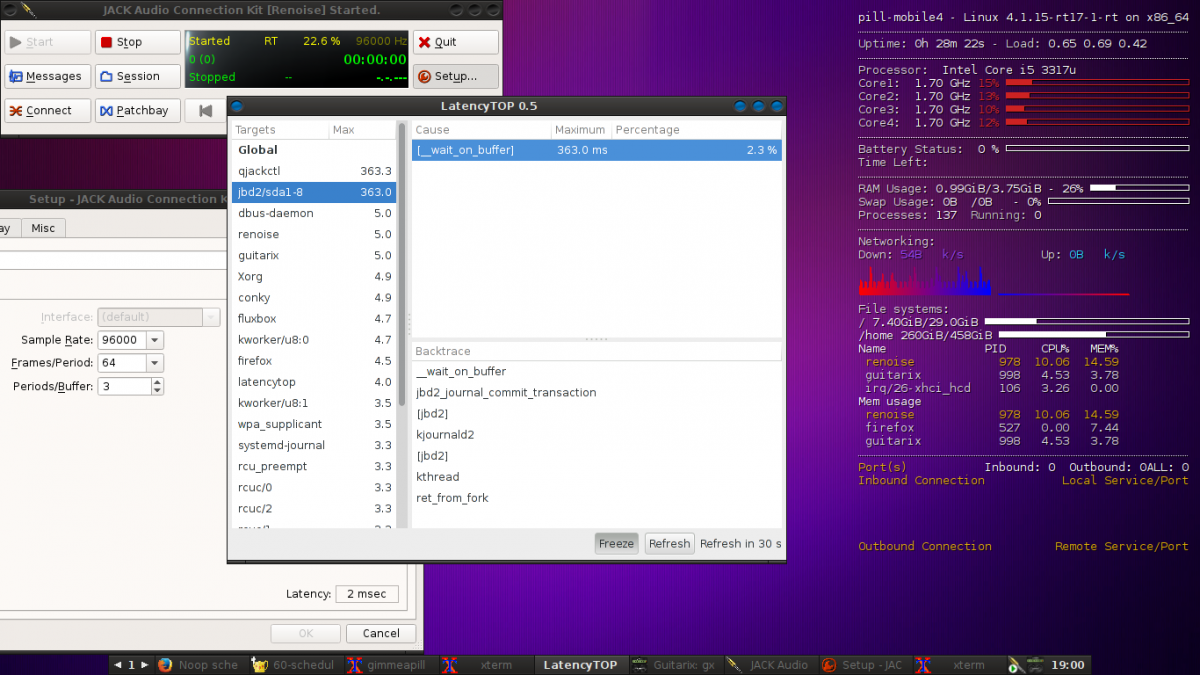
qjackctl is also waiting for “jbd2_log_wait_commit”
This happens roughly every 5 secs while a Renoise pattern is looping (no particular I/O operation going at that time).
That drive is mounted with noatime,data=ordered and use the default scheduler (CFQ). So as far as I can tell, the behavior is consistent with the peaks I saw in oscilloscope a few posts above.
Since shelling out some cash for a 512GB SSD is currently not an option, I will try to tune a bit the scheduler (noop is on the top of my list) and mount options.
I’ll be back 
I doubt it be your bottleneck. Normally shit like this is interruptable with a realtime kernel and proper irq priorities set up. latencytop is some old tool, I guess without realtime scheduling in mind at all. Max peaks 22µs in cyclictest is already very, very, very good, no reason to investigate any further in tuning.
If you wanted to find the real culprits for cyclictest realtime latency peaks: http://people.redhat.com/williams/latency-howto/rt-latency-howto.txt - but you’ll get mad over the fucking logs like myself until I found the ubuntu nouveau module and then general shortcomings of a non-hard-rt kernel being reason for cyclictest peaks, which could be resolved. But I’d only ever dabble in this again…if I had bad cyclictest readings to begin this.
I still believe our strange xruns are some shortcomings of renoise itself, not our system tunings. You did mention other realtime audio dsp stuff can run for you without xruns?
Yeah, the next step would be ftrace - I’m not going there, this is more for developers and I would probably not be able to make much sense of the output. But thanks for the pointer.
All the user level tools are unfortunately getting old. LatencyTop has at least the advantage of being easy to use and still seems to give plausible results on my modern system.
What I found weird is that until jack is running I don’t see those latency peaks from jbd2. It starts with jack (even if no audio application is running), so there could be a preemption issue there. I’ll try maybe to play with the process priority see if it changes anything.
Out of curiosity, I also tried the noop scheduler on my spinning drive and it only makes things worse. So, as you said, I’m pretty much done with the tuning.
My system is otherwise ok - up to a certain point. I can run at low latency with Guitarix and Hydrogen (96khz * 64 periods * 3 buffers) without a single xrun in a 2h session. Guitarix alone runs fine even lower at 96khz * 32 periods * 3 buffers (~1.2 ms playback latency or 3-4ms roundtrip) if I don’t touch the presets.
Problems start with bigger apps like Ardour or Renoise.
Renoise itself runs ok’ish without effects at 96khz * 64 periods * 3 buffers. This is just good enough for recording, then I usually work at higher latency to add stuff.
OopsIFly, I played a bit with the Cab Sim over the week end and confirm what you’ve found: it’s horrible - particularly when changing presets.
Even at 20ms latency, it triggers xruns by the dozen and this doesn’t seem related to cpu load. Things get of course more messy when adding several of them.
There’s something really wrong with that one - the tube emulation sounds otherwise pretty good.
