If I play a pure 100Hz sine wave (full peak to peak +1 -1), 0db track headroom and display this in the frequency spectrum, I get:
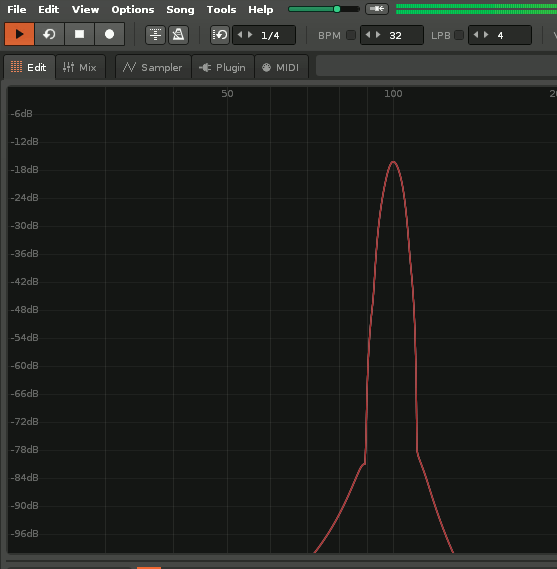
I’m no expert in this (I could’ve missed something obvious), but should that drawn peak be a bit more closer to 0db? Rather than graphically displaying about -15.75db according to that ruler(?) I can understand +0.3db or -0.5db off when run through the algorithm and drawn, but -15.75db? Sure it is probably just a graphical thing (no detriment to the sound), I still kinda get the feeling that that is…
Not sure, but I guess you have to calculate the integral.
Found this: https://dsp.stackexchange.com/questions/32076/fft-to-spectrum-in-decibel
So, you are right. It should be at 0 dBFS or -3dB respectively as written in the thread.
1 Like
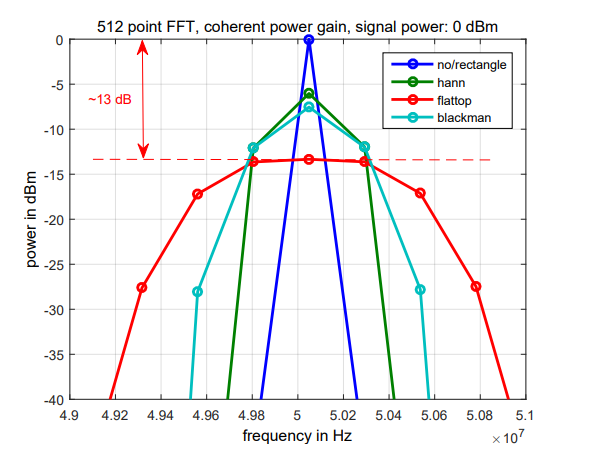
I think the short answer is “FFT amplitude is reduced in practice by the use of windows.”
1 Like
If it was me writing a no slope frequency plot routine my gut instinct would be that it registers close to 0db from a musicians perspective. But I’m no expert and it isn’t my program, so I suppose it doesn’t matter.
So… If a 0dB sine would be plotted correctly on a spectrum, the line would be so thin that you couldn’t see it.
But with a full mix or sound, you will get a good visual representation of the amount of energy within a range? (it’s not like the slopes add up to result in a misrepresentation?)
I think the analyzer wastes a lot of space on the top. No track ever reaches 0dB in a specific frequency, and if so, it is too loud, so why not also visually “clip” it then? Esp. this is not possible if the track headroom is set to -6dB. The analyzer could be a bunch smaller, so wasting less GUI space and still looking fine.
At least it could start to cutoff from top and bottom if you scale it down vertically really much.
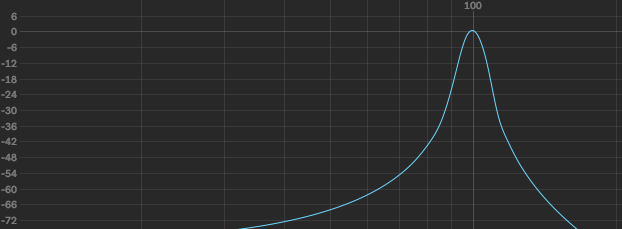
I’m just simply saying that if I feed in a full peak to peak sine wave (no attenuation AFAIK) at 100Hz, no slope and show it on the spectrum I would’ve expected something like:
With Renoise according to the ruler and cross hair I get the peak around -15db down (unless I’ve missed something). Now maybe Renoise is right and that’s how it is scaled into the window and/or that’s how the FFT algorithm ‘works’(?) So long as people are happy with it though, it doesn’t really matter…
I work around this problem (wasted vertical space) with send channels. I have 3 extra send channels, two for the analyzers and a third dummy so I can mute the other 2 with a zero percent send.
In the channels are also gainers, boosting by whatever amount I want.
Then I use send “keep” devices that I place in the channels or fx chains. They send to the analyzer channels from wherever I want. Also from in between the fx chains…
Sorry for the bump, I forgot to mention that I read with the release of Bitwig 3.3 one of the ‘improvements’ is:
“Frequency spectrum displays throughout the program are now calibrated for peak sine”
Maybe not a big deal, but a least (to me) it shows that I was thinking about it logically.
I just would like to add that the spectrum analyzer seems to display a very different graph if I switch from 48kHz to 44.1kHz output, especially the bass area seems to be very imprecise at 44.1kHz. I think there is a logical bug in the analyzer.
EDIT: Or maybe it is gone in 3.3 or I forgot how to reproduce this.