Could it be possible to have time on the spectrogram on the X-axis (rotate the thing 90 degrees to left)? It feels more natural way to view it that way.
Like this:
2665 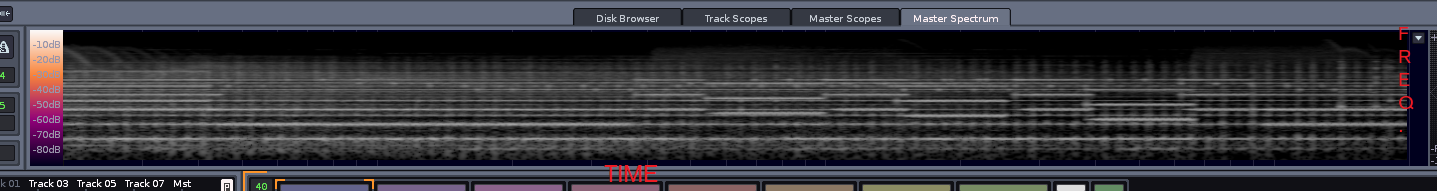
Could it be possible to have time on the spectrogram on the X-axis (rotate the thing 90 degrees to left)? It feels more natural way to view it that way.
Like this:
2665
+1 And also the ability to scale the frequency axis so that one can scroll up and down. Like in the Sonogram-SG1 vst ![]()
it could, but actually you will lose a lot of information about the frequencies if i have to squeeze everything in a few pixel tall. think vertically ?
let’s see if this is a viable feature during the beta.
I know but I’d still prefer it that way ![]()
E: but I need to emphasise that it should be selectable
A scrolling oscilloscope aks “scrolloscope” would be nice to have, like this one http://das.nasophon…_oscrolloscope/ It displays waveform data for every single channel and the scrolling speed can be adjusted.
EDIT: Sorry didn’t read that properly as Spectrogram. Igor this post.
As you wish! ![]()
I know this is a bit of hijacking the thread, but if it were possible to have two scrolling oscilloscopes which were track selectable (like the current frequency analysers in 2.8) it would be ideal if you wanted to look at two different channels over time simulataneously, you know, like if you had an A and B group in a real-time performance tool ![]()
Hey, I’m just gonna bump this to say I’d really like a horizontally scrolling spectrogram too.
The current view where frequencies are spread across the width of the screen is waay too much information to focus on at once, and it all seems to blur together because the time dimension is so condensed (even when scrolling at maximum speed)
Peace out 